Grade K: EDC Graph – End of October

Instructor Notes:
For materials preparations, click ‘Back to Main Menu’ button and select ‘Getting Started – EDC Setup’.
Read Every Day Counts Teacher’s Guide, Kanter and Gillespie, Great Source, 2005 or 2012 edition, p. 41-43.
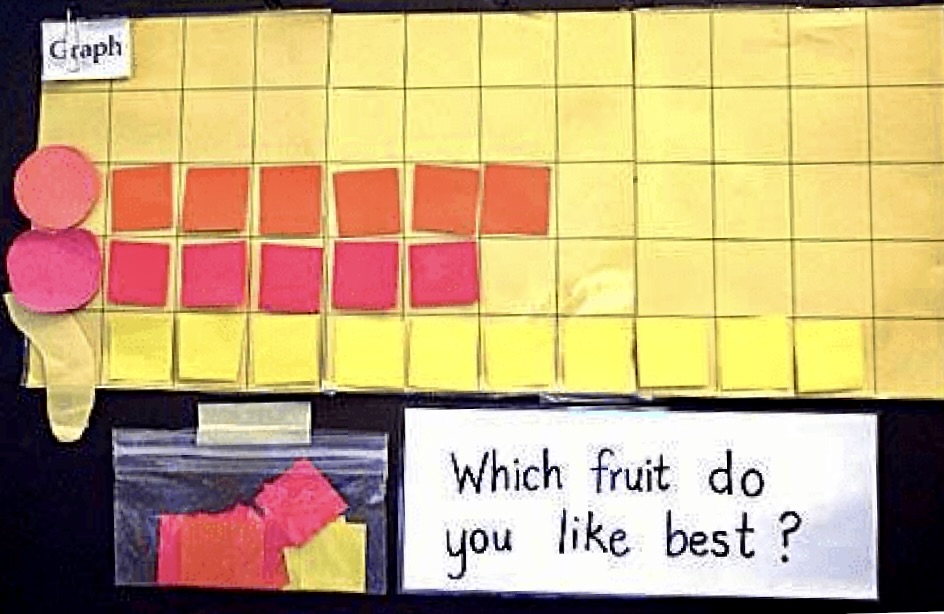
Finally, with all the children’s markers on the graph, it will be fun to see if the class’ earlier predictions prove true or not. Does the choice that had the most “votes” after the first or second draw of markers still have the most?
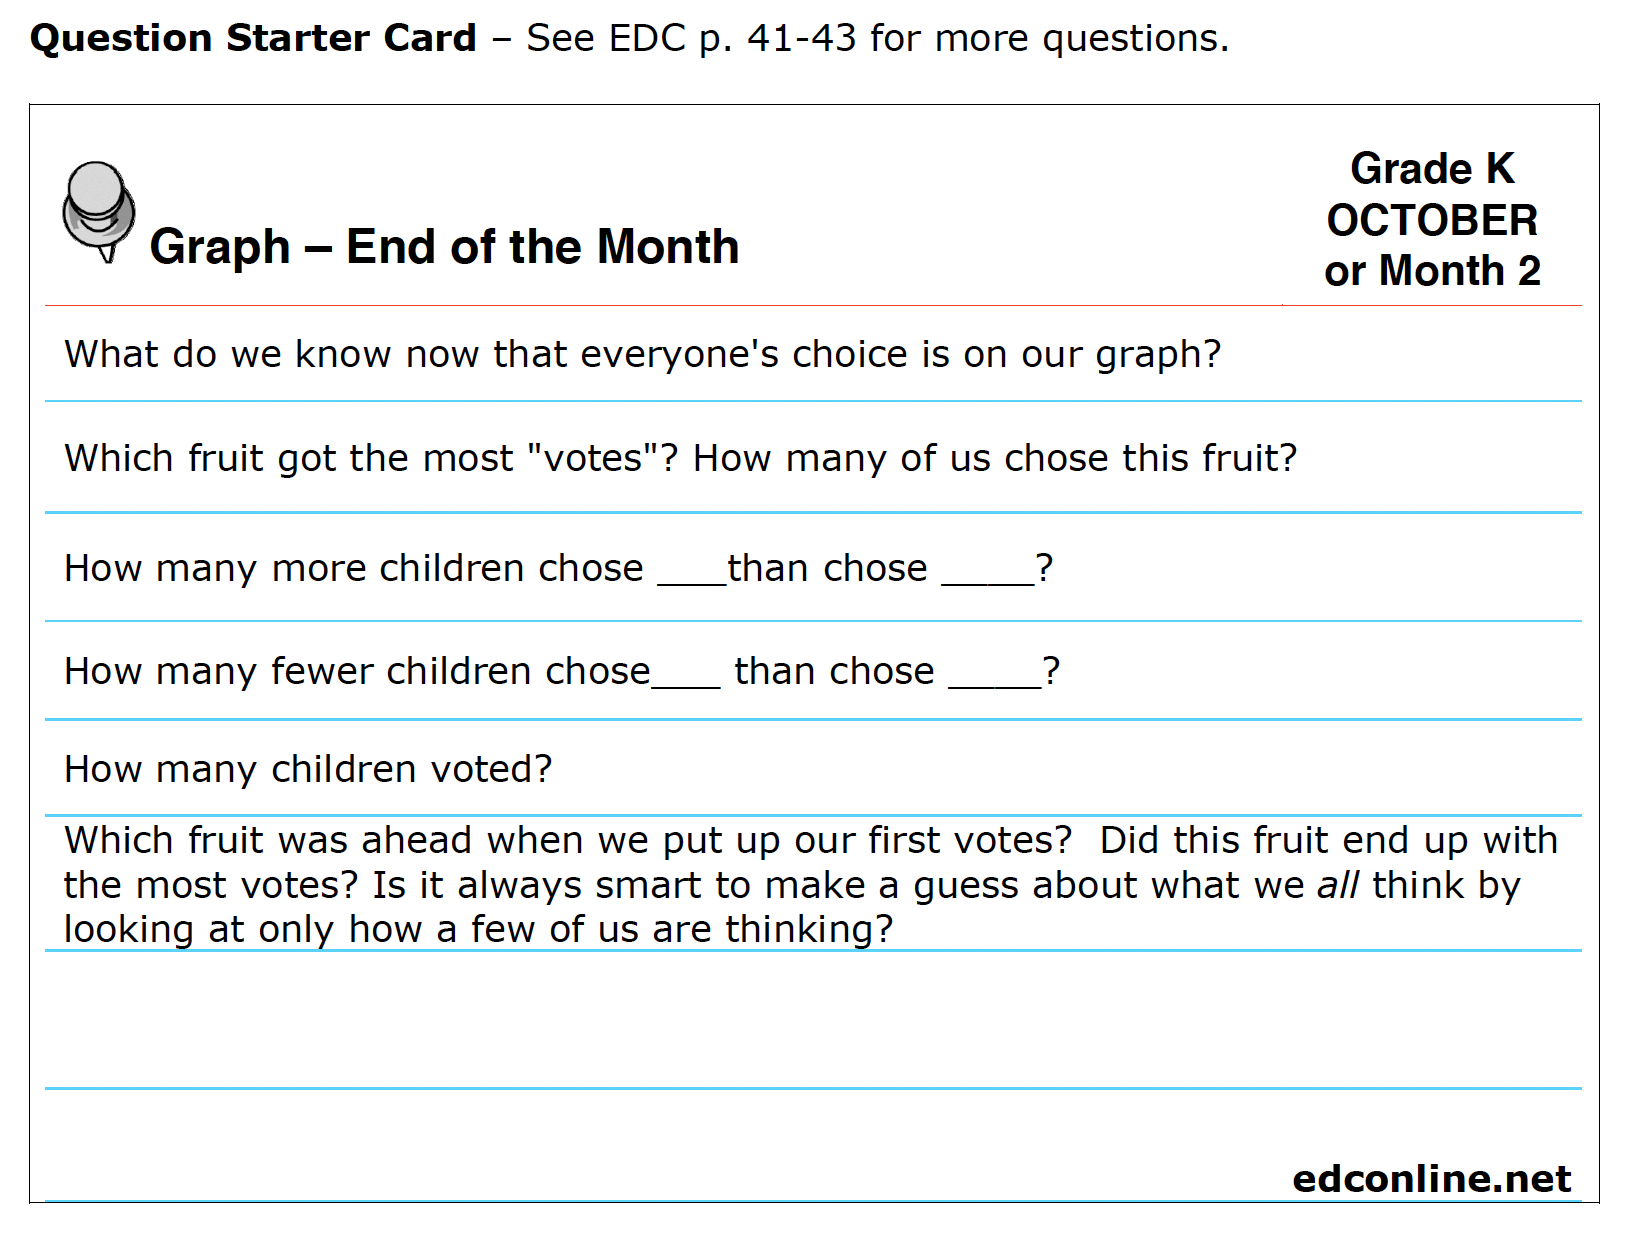
At month’s end, we can continue to help children count and compare small quantities by asking “How many more __ than __?” and “How many fewer ___ than ___?”


