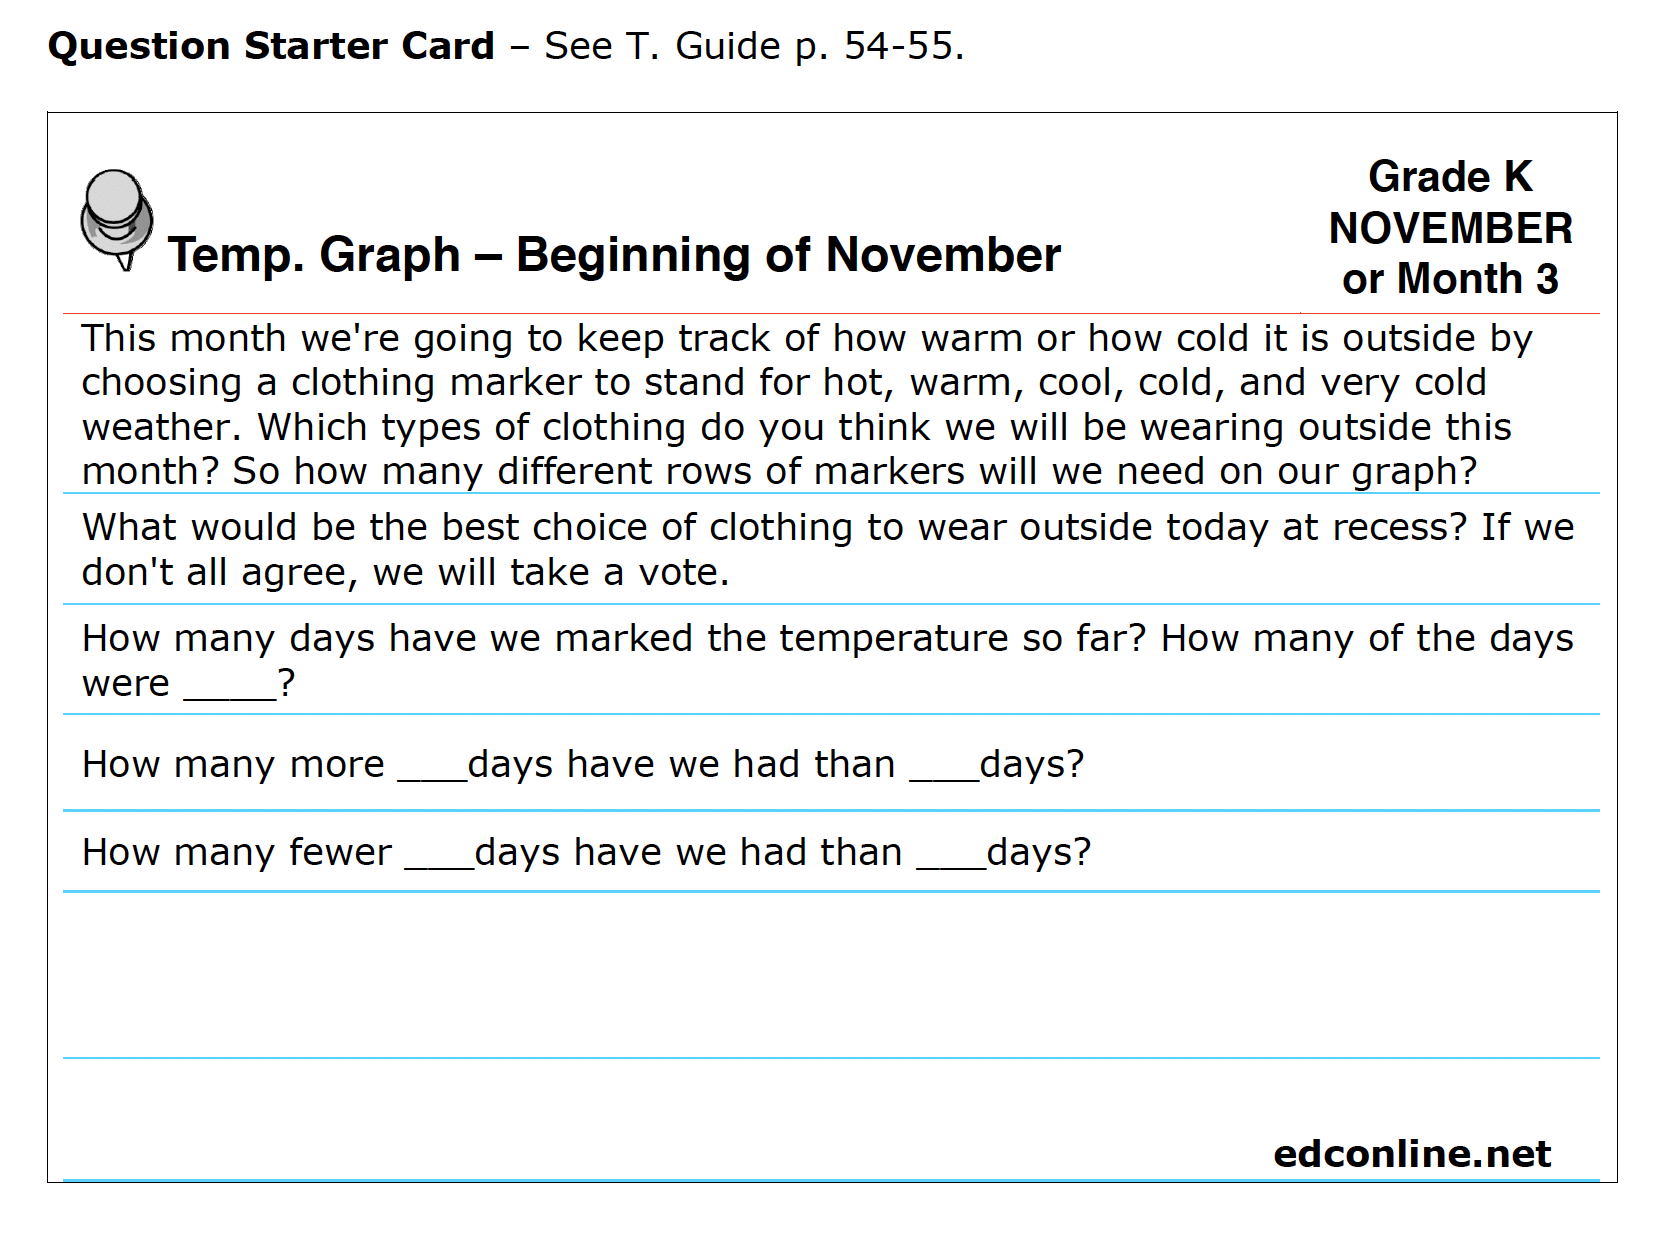
Grade K: EDC Temperature Graph – Beginning of November

Instructor Notes:
For materials preparations, click ‘Back to Main Menu’ button and select ‘Getting Started – EDC Setup’.
Read Every Day Counts Teacher’s Guide, Kanter and Gillespie, Great Source, 2005 or 2012 edition, p. 54-55.
This month’s graph gets children talking about what clothes are appropriate to wear outside depending on the day’s temperature. After matching up the tank top, t-shirt, sweater, jacket, and hat and mittens pictures with hot, warm, cool, cold, and very cold temperatures, let the class help figure out how to arrange the Every Day Graph grids to create the month’s blank graph. You may want to decide on only three choices appropriate to your location’s November temperatures, instead of five, in order to make the graph easier to read.
Each day at recess time, we can ask what the children think is the most appropriate clothing to wear outside and place the marker of their choice on the graph. Once or twice a week we can ask questions that encourage everyone to count and compare the rows of temperature markers.


